01
Data Visualization
Real-time dashboards your team actually uses, with role-based access and docs built in.
Dashboards, pipelines, and automations that turn messy data into clear answers, so you can invest your time and attention where it matters.
Production systems shipped for teams across
I offer four core services to help businesses gain clarity from their data, efficiency from their workflows, and leverage from AI where it genuinely fits.
Real-time dashboards your team actually uses, with role-based access and docs built in.
Every source consolidated into one clean, scheduled pipeline, ready in your warehouse.
Repetitive work, entry, reports, notifications, handed to systems your team runs.
AI only where it earns its cost, proven with a small pilot before you scale.
Most of my work lives inside client systems, not on display. But here are a few examples that show how I approach problems and what the results look like.
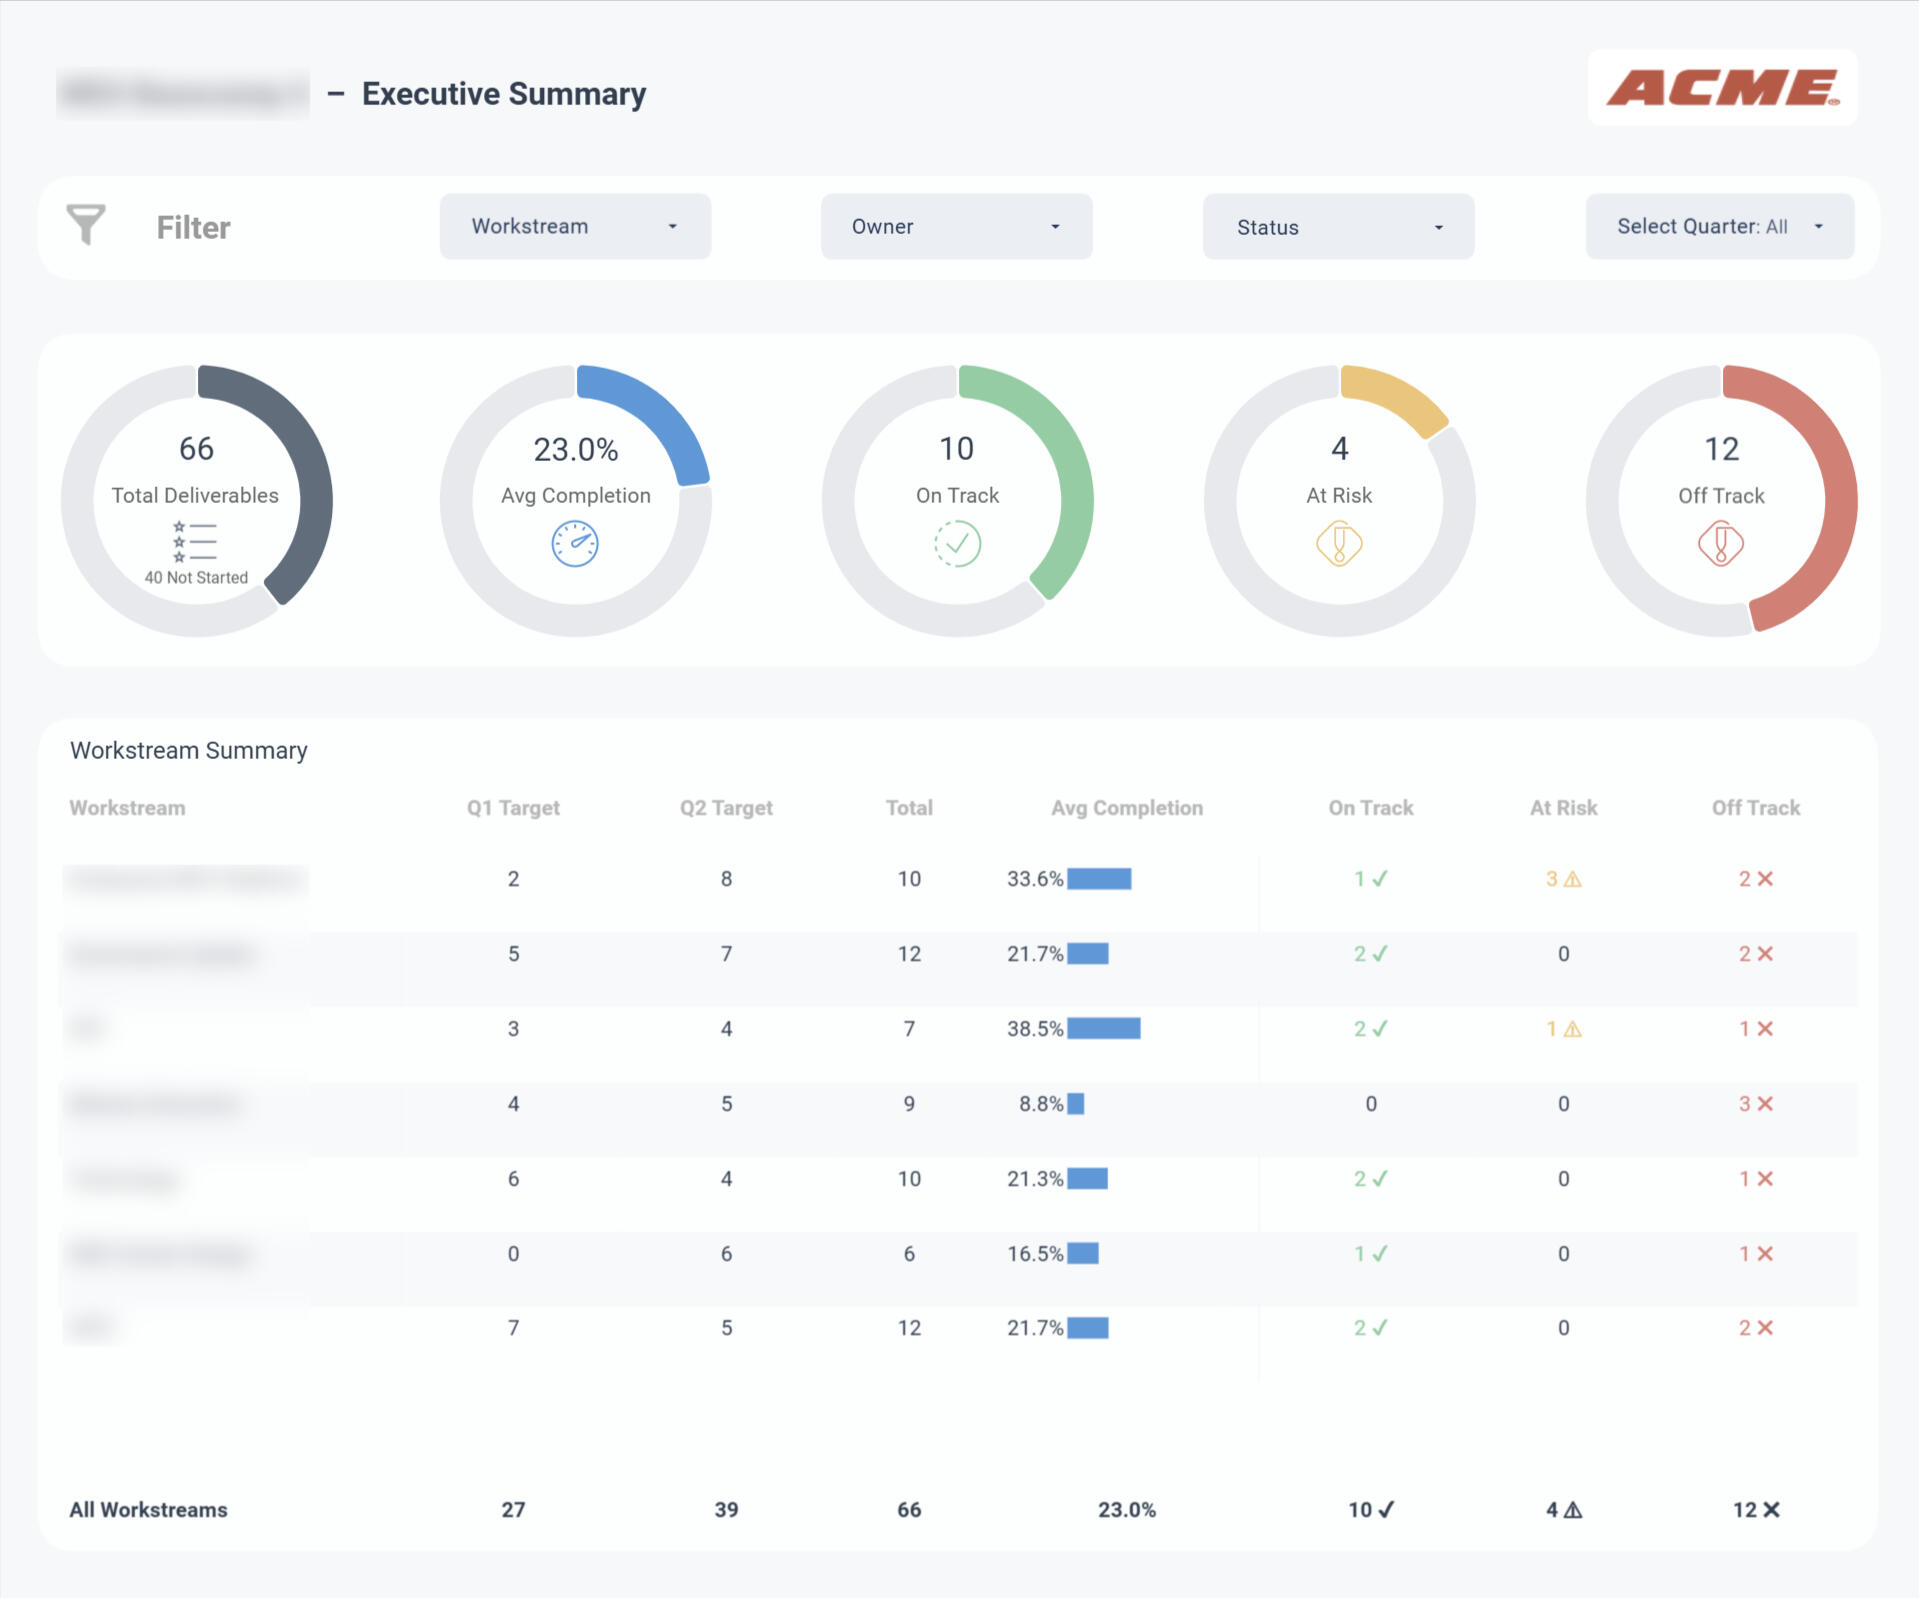
A government program team was managing 66 deliverables across 7 workstreams using Excel spreadsheets. Leadership had no real-time view of what was on track, at risk, or falling behind. Status updates required manual compilation before every review meeting.
I built a 2-page Looker Studio dashboard connected to a Google Sheets backend. The Executive Summary page shows five KPI scorecards with donut ring indicators, a workstream summary table with automated RAG color coding, and filters by workstream, owner, status, and quarter. The Action Items page automatically surfaces at-risk and blocked deliverables. RAG thresholds are configurable, so the team can adjust sensitivity without touching formulas.
OutcomeReal-time program visibility. No manual status compilation. Leadership reviews run off one live dashboard.
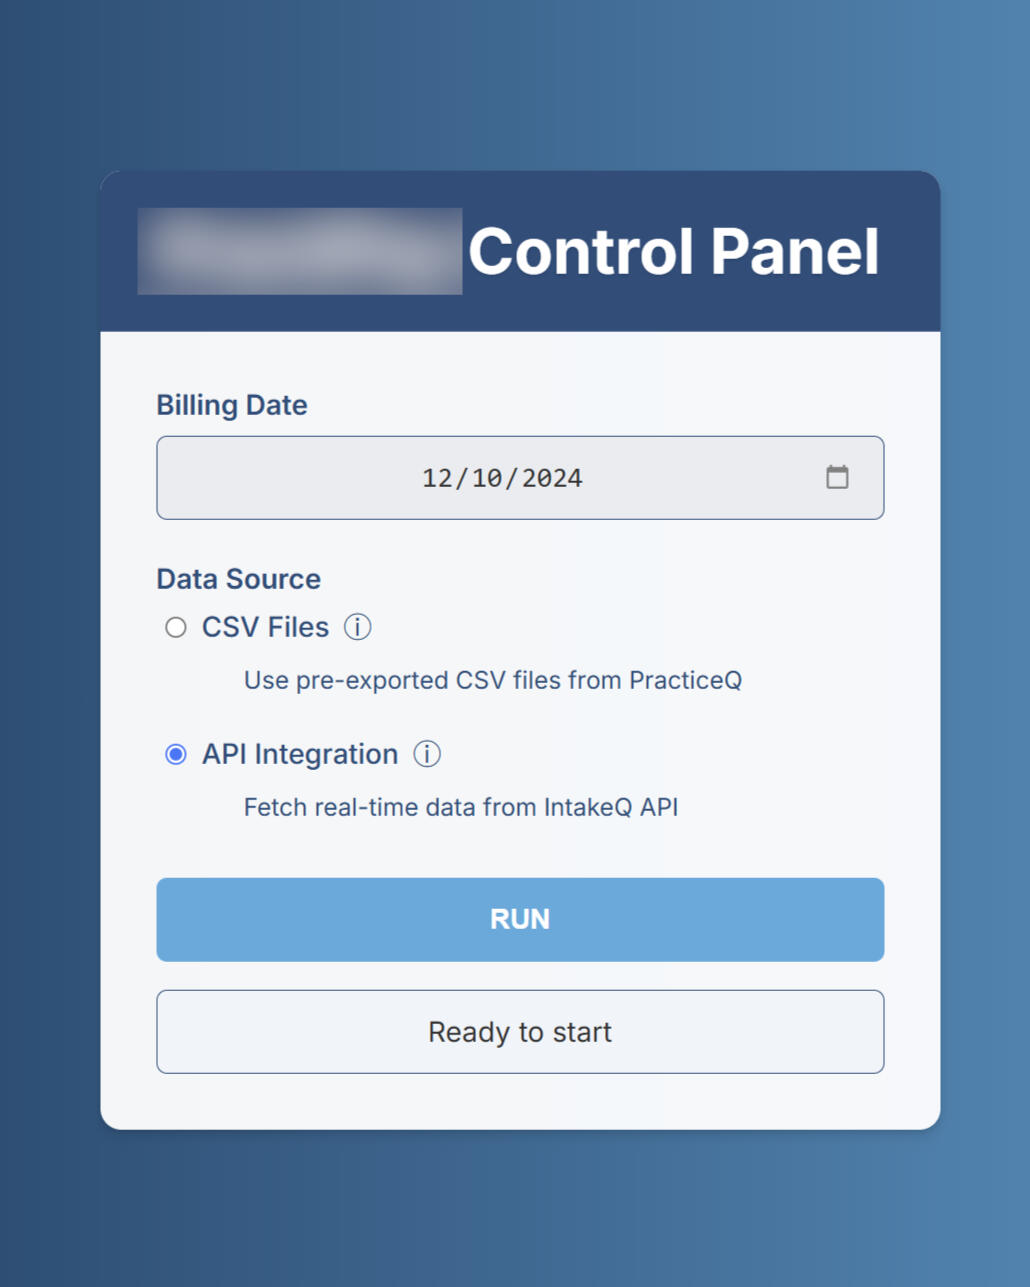
A behavioral health clinic with 30+ practitioners was running payroll manually each billing cycle. Staff cross-referenced CSV exports from their practice management system, looked up rates, validated CPT codes, and categorized reimbursements by hand. The process was slow, error-prone, and repeated every cycle.
I built a Google Apps Script web app that connects directly to the IntakeQ API, pulling appointment and billing data automatically. The backend handles rate lookups, CPT validation, reimbursability categorization, and generates template-based pay summaries for each practitioner. Chunk-based processing handles 100+ appointments and 300+ API calls per cycle within Apps Script's execution limits.
OutcomeOne-click payroll processing. No more manual cross-referencing. Billing cycle prep that took hours now runs automatically.
A subscription business needed visibility into revenue trends, member lifecycle, and conversion metrics. Data lived in spreadsheets and required manual cleanup before any reporting could happen.
I wrote a Google Apps Script to automate the data transformation, then built a Looker Studio dashboard with real-time refresh. The dashboard includes MRR tracking, revenue breakdowns by source, member acquisition trends, and a visitor-to-customer funnel.
OutcomeLive metrics. No manual prep. One place to see what's working.
An e-commerce business needed to see profitability across multiple ad channels (Google, Bing, Meta, Criteo) alongside Shopify sales, COGS, and logistics. Data lived in different systems. Reporting was slow and fragmented.
I built an end-to-end analytics platform. Fivetran pulls data into BigQuery. Python pipelines handle FX rates and P&L calculations on a schedule. Tableau dashboards deliver the final view with row-level security and currency/timezone toggles.
OutcomeOne source of truth. Real-time visibility into what's profitable and what's not.
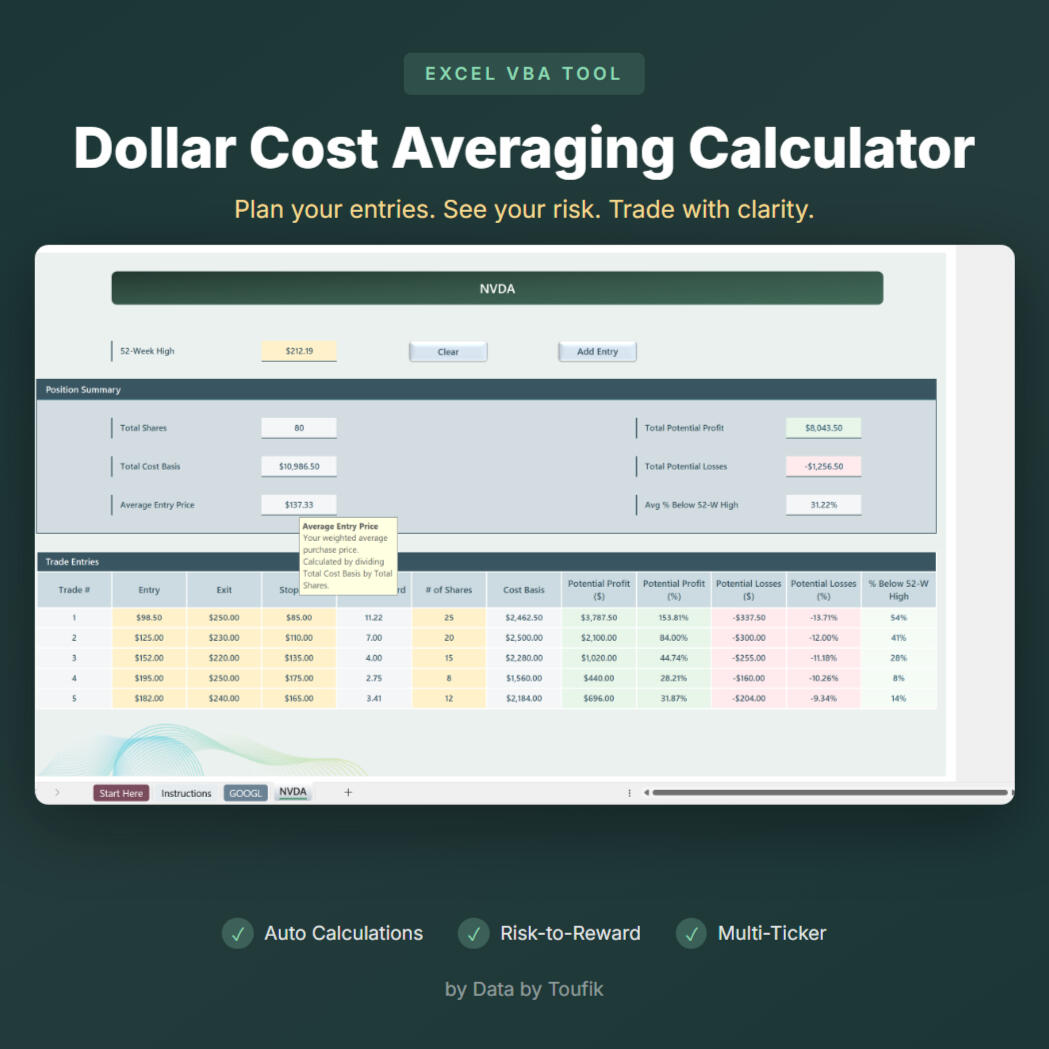
A landscaping and snow removal company managed properties across multiple US states. Pricing varied by location, property type, crew size, and service model. Calculating bids was slow and error-prone.
I built an Excel VBA tool with one-click automation. Dynamic pricing by state and city, multiple snow pricing models (Per Service, Per Event, Seasonal), crew multipliers, and production profiles. All pricing, profit margins, and settings are configurable through dedicated sheets, so the client can adjust without touching code. Built with a modular architecture that scales as the business grows.
OutcomeFast, accurate bids. No manual calculations. Easy to update as the business grows.
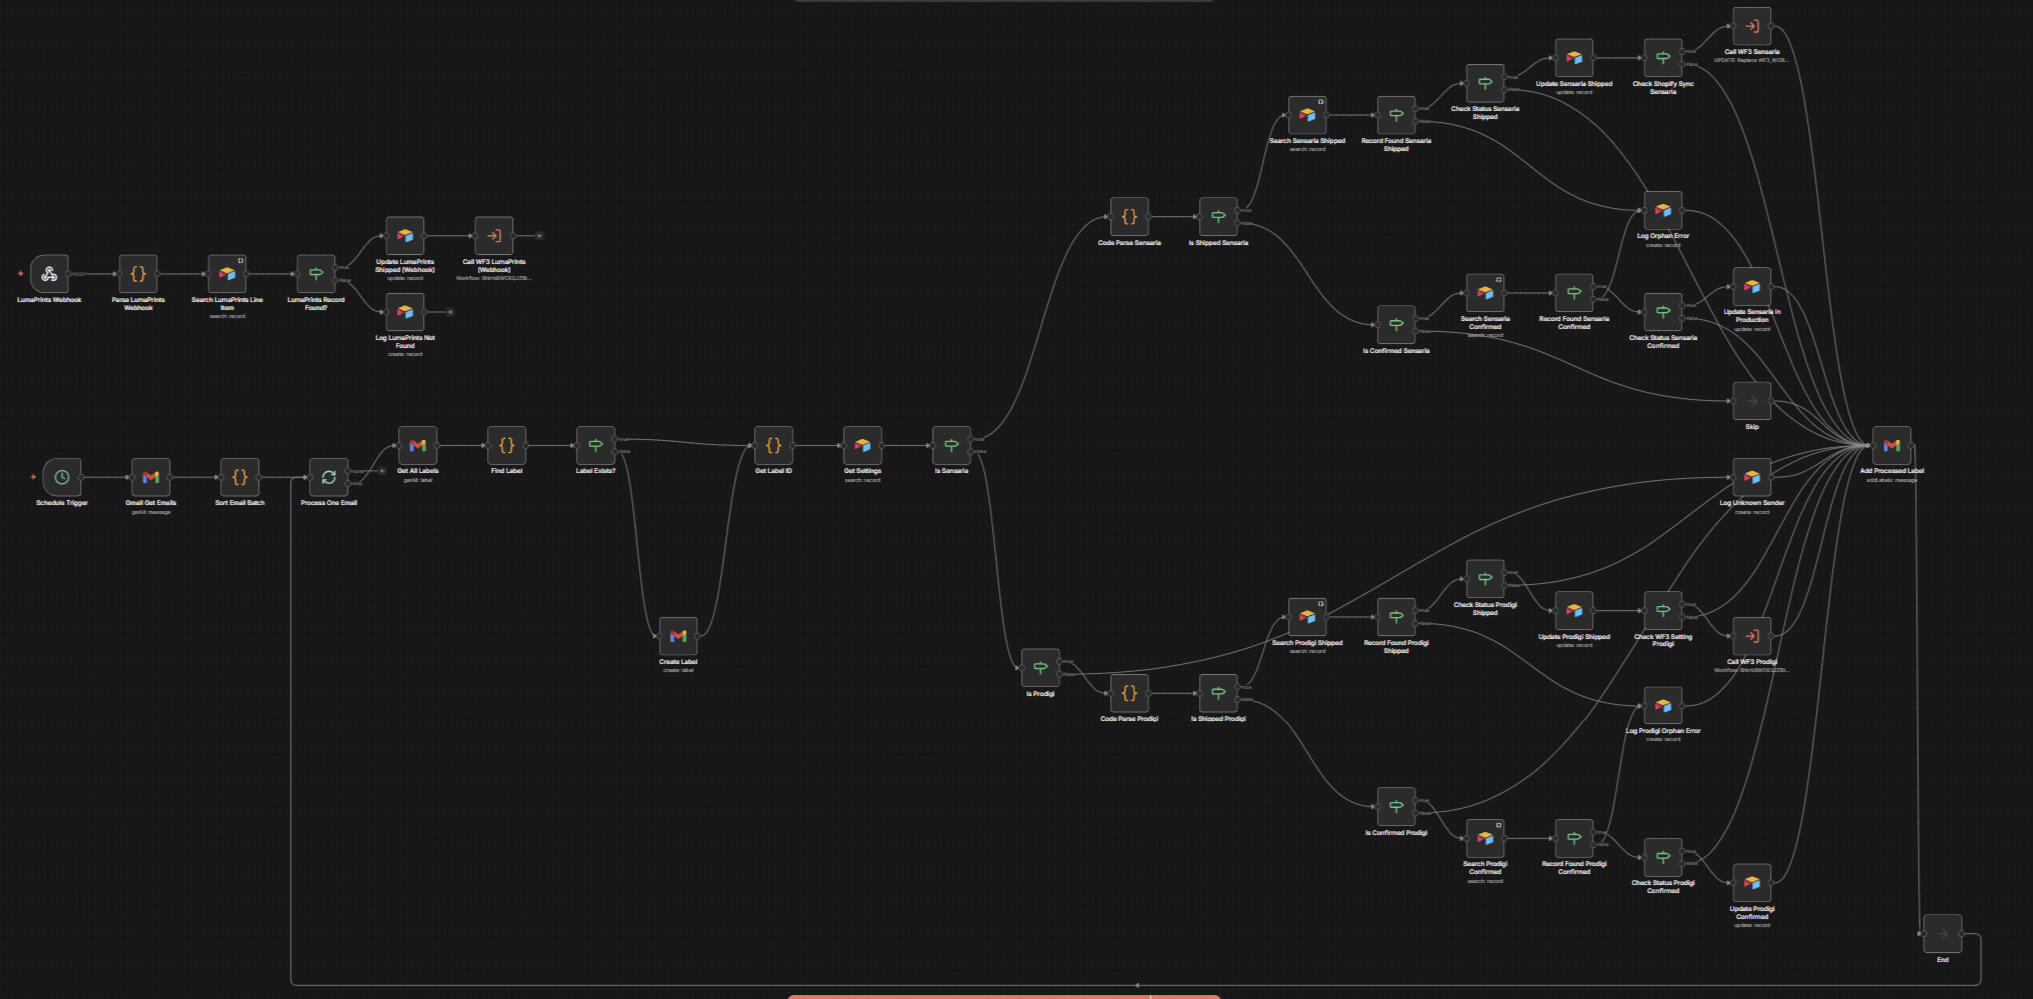
An art e-commerce store was managing orders across three print-on-demand suppliers manually. Order intake, production tracking, shipping updates, and customer fulfillment notifications all required human coordination between Shopify, email, and supplier portals.
I built a 5-workflow n8n automation system that handles the full order lifecycle. Shopify webhooks capture new orders into Airtable, supplier email parsing extracts production status and tracking numbers, and the Fulfillment API syncs tracking to customers automatically. The system includes direct API integration with one supplier for multi-panel artwork lookups and duplicate prevention, 3-layer carrier normalization covering 37 carriers (327 test cases, 100% pass rate), and Google Chat Cards V2 notifications with interactive submit forms for the team.
OutcomeOrders routed, tracked, and fulfilled without manual intervention. The team manages everything from Airtable and Google Chat.
A robotics team needed a system to handle purchase requests and reimbursements. Requests came through Google Forms, then required approval from different teams depending on the type and amount. Approvers needed to respond via Slack or email. Tracking was manual, and there was no visibility into budgets or bottlenecks.
I built a Google Apps Script system that routes each request to the right approval chain, sends notifications via Slack and email, captures approver feedback, and triggers the next step automatically. The system tracks workflow stages, monitors department budgets, and flags overdue requests. A 4-page Looker Studio dashboard provides near real-time visibility into active requests, approval times, spending by department, and budget utilization.
OutcomeRequests routed, approvals collected, budgets monitored. All automated.
Real feedback from client contracts on Upwork.
“Great worker and great communicator. We have nothing to complain about. Works fast at an affordable rate. Would highly recommend.”
“Working with Toufik was seamless - he went above and beyond to make sure everything was done properly.”
“Second contract with Toufik, amazing work both times! Works very quickly, communicated very very well and got work done exactly as described. Highly recommend!”
I build tools and templates from real project work, each fully documented and ready to use out of the box.

I started in telecommunications: four years as a radio engineer at Bouygues Telecom France (via Accenture), learning how large systems work and how to spot problems before they become crises.
Then I shifted into data, joining two early-stage blockchain projects (Mysten Labs and Rug Radio) with remote international teams. That's where it clicked: turn messy data into clear answers, and manual processes into automated workflows.
Today I build dashboards teams actually use, pipelines that run without babysitting, and automations that save hours every week, for clients across e-commerce, finance, crypto, marketing, and operations. The best tools are the ones people use, not the ones with the most features.
Let's work together.
Let's talk about how we can work together.
I usually reply within 1-2 business days. No pitch, just a straight conversation about whether it's a good fit.
Your message has been sent. I'll review it and get back to you within 1-2 business days.